


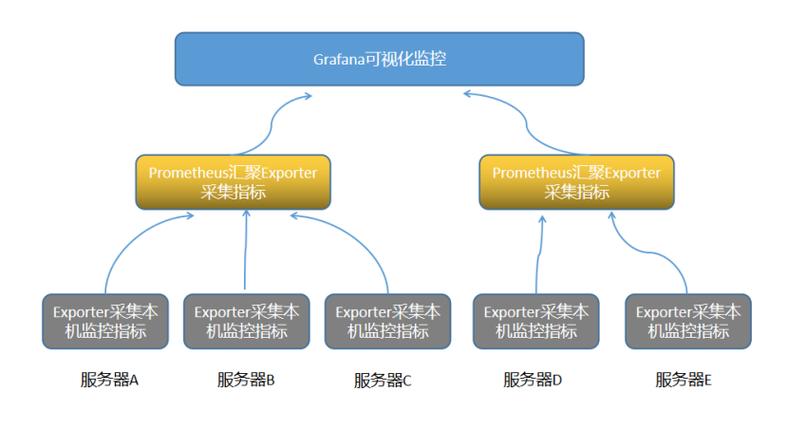
在本文中,我们将详细介绍如何在Grafana中配置Prometheus,Grafana是一个开源的度量分析和可视化套件,常常用于可视化时间序列数据,而Prometheus是一个开源的监控和警报工具包,专门用于处理大规模的服务和系统监控。

步骤一:安装并运行Prometheus
我们需要在服务器上安装并运行Prometheus,以下是在Ubuntu上安装Prometheus的命令:
sudo aptget update
sudo aptget install prometheus
sudo systemctl start prometheus
sudo systemctl enable prometheus
安装完成后,我们可以通过访问http://localhost:9090/graph来查看Prometheus的运行状态。
步骤二:安装并运行Grafana
接下来,我们需要在服务器上安装并运行Grafana,以下是在Ubuntu上安装Grafana的命令:
sudo aptget install y apttransporthttps curl gnupg2 softwarepropertiescommon
curl s https://packages.grafana.com/gpg.key | sudo aptkey add
echo "deb https://packages.grafana.com/oss/deb stable main" | sudo tee a /etc/apt/sources.list.d/grafana.list
sudo aptget update && sudo aptget install grafana
sudo systemctl start grafanaserver
sudo systemctl enable grafanaserver
安装完成后,我们可以通过访问http://localhost:3000来查看Grafana的运行状态。
在Grafana中添加Prometheus数据源的步骤如下:
1、登录到Grafana,点击左侧菜单栏的"Configuration"(配置)。
2、在弹出的菜单中选择"Data Sources"(数据源)。
3、点击"Add data source"(添加数据源)按钮。
4、在弹出的列表中选择"Prometheus"。
5、在"URL"字段中输入Prometheus的URL,格式为http://<prometheus_host:9090,如果Prometheus和Grafana在同一台服务器上,那么URL就是http://localhost:9090。
6、点击"Save & Test"(保存并测试)按钮。
7、如果一切正常,你会看到一个绿色的对勾和一个消息"Data source is working"(数据源正常工作)。
步骤四:创建Grafana仪表板并添加图表
在Grafana中创建仪表板并添加图表的步骤如下:
1、登录到Grafana,点击左侧菜单栏的"Create"(创建)。
2、在弹出的菜单中选择"Dashboard"(仪表板)。
3、点击"Add panel"(添加面板)按钮。
4、在弹出的列表中选择你想要添加的图表类型,quot;Graph"(图表)。
5、在图表设置中,选择你刚刚添加的Prometheus数据源,然后选择你想要查询的度量和标签。
6、调整图表的其他设置,例如颜色、大小等。
7、点击"Save"(保存)按钮。
8、你可以通过点击图表右上角的铅笔图标来编辑图表,或者通过拖拽图表来调整其在仪表板中的位置。
步骤五:配置Prometheus Alertmanager以发送警报到Grafana
我们需要配置Prometheus的Alertmanager以发送警报到Grafana,以下是一个简单的Alertmanager配置文件示例:
global:
  resolve_timeout: 5m
route:
  group_by: ['alertname', 'priority']
  group_wait: 30s
  group_interval: 5m
  repeat_interval: 3h
  receiver: 'webhook_receiver'
receivers:
name: 'webhook_receiver'
  webhook_configs:
  url: 'http://localhost:3000/alerting/notifications'
    send_resolved: true
在这个配置文件中,我们定义了一个名为webhook_receiver的接收器,它会将警报发送到Grafana的/alerting/notifications端点,你需要将url字段中的地址替换为你的Grafana实例的实际地址。
完成以上步骤后,你就可以在Grafana中看到Prometheus的数据,并在满足某些条件时收到警报了。
FAQs
Q1:我无法在Grafana中看到Prometheus的数据,怎么办?
A1:请检查你的Prometheus和Grafana是否已经正确安装并运行,你可以在浏览器中访问Prometheus和Grafana的管理界面来检查它们的运行状态,确保你已经在Grafana中添加了正确的Prometheus数据源,并且已经成功创建了仪表板和图表,如果你仍然无法看到数据,那么可能是你的Prometheus配置有问题,或者你的网络连接有问题,你可以查看Prometheus和Grafana的日志来获取更多的错误信息。
Q2:我收到了一个警报,但是我不知道这个警报是什么意思,怎么办?
A2:警报通常包含一些元数据,例如标签、表达式、频率等,这些信息可以帮助你理解警报的含义,你可以通过点击警报来查看这些元数据,你也可以查看Prometheus的表达式浏览器来理解你的警报表达式,如果你仍然无法理解警报的含义,那么可能是你的警报规则有问题,或者你的度量指标有问题,你可以联系你的系统管理员或者Prometheus的社区来寻求帮助。
原创文章,作者:未希,如若转载,请注明出处:https://www.kdun.com/ask/612788.html
本网站发布或转载的文章及图片均来自网络,其原创性以及文中表达的观点和判断不代表本网站。如有问题,请联系客服处理。
发表回复